iCREPCP Documentation
How to use
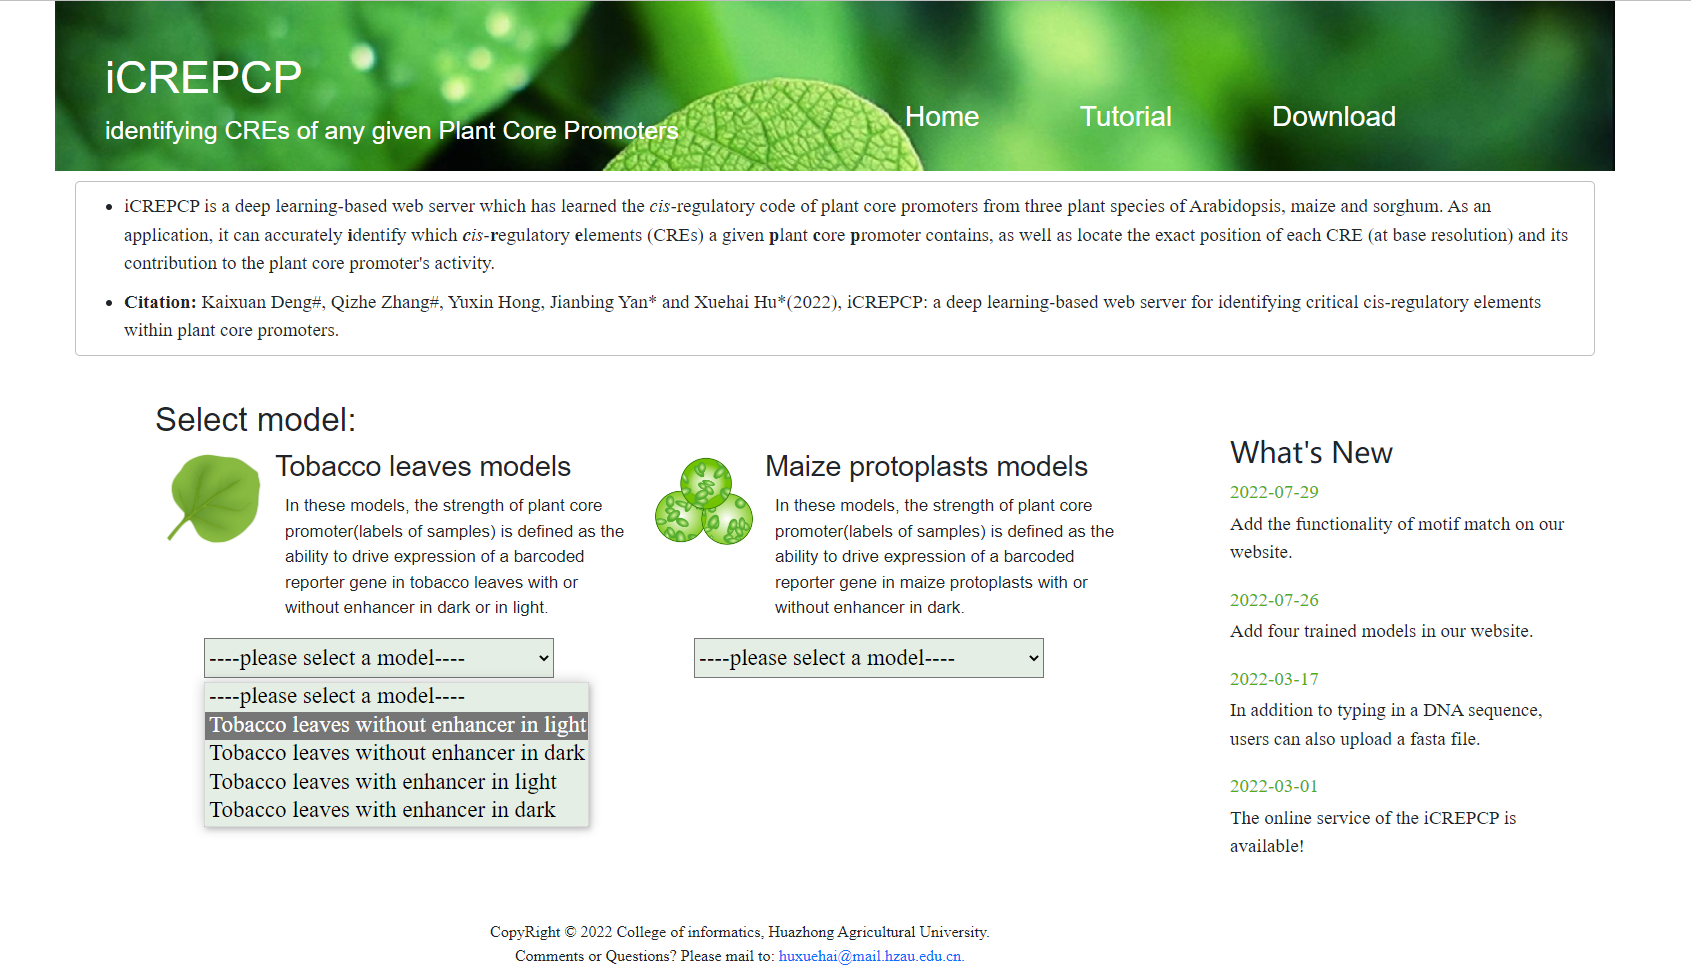
- Select a model: tabacco leaves models with/without enhancer in dark or in light or maize protoplasts models with/witout enhancer in dark. If you do not konw which model to choose, we recommend you to select the tobacco leaves model without enhancer in light according to our experiences.
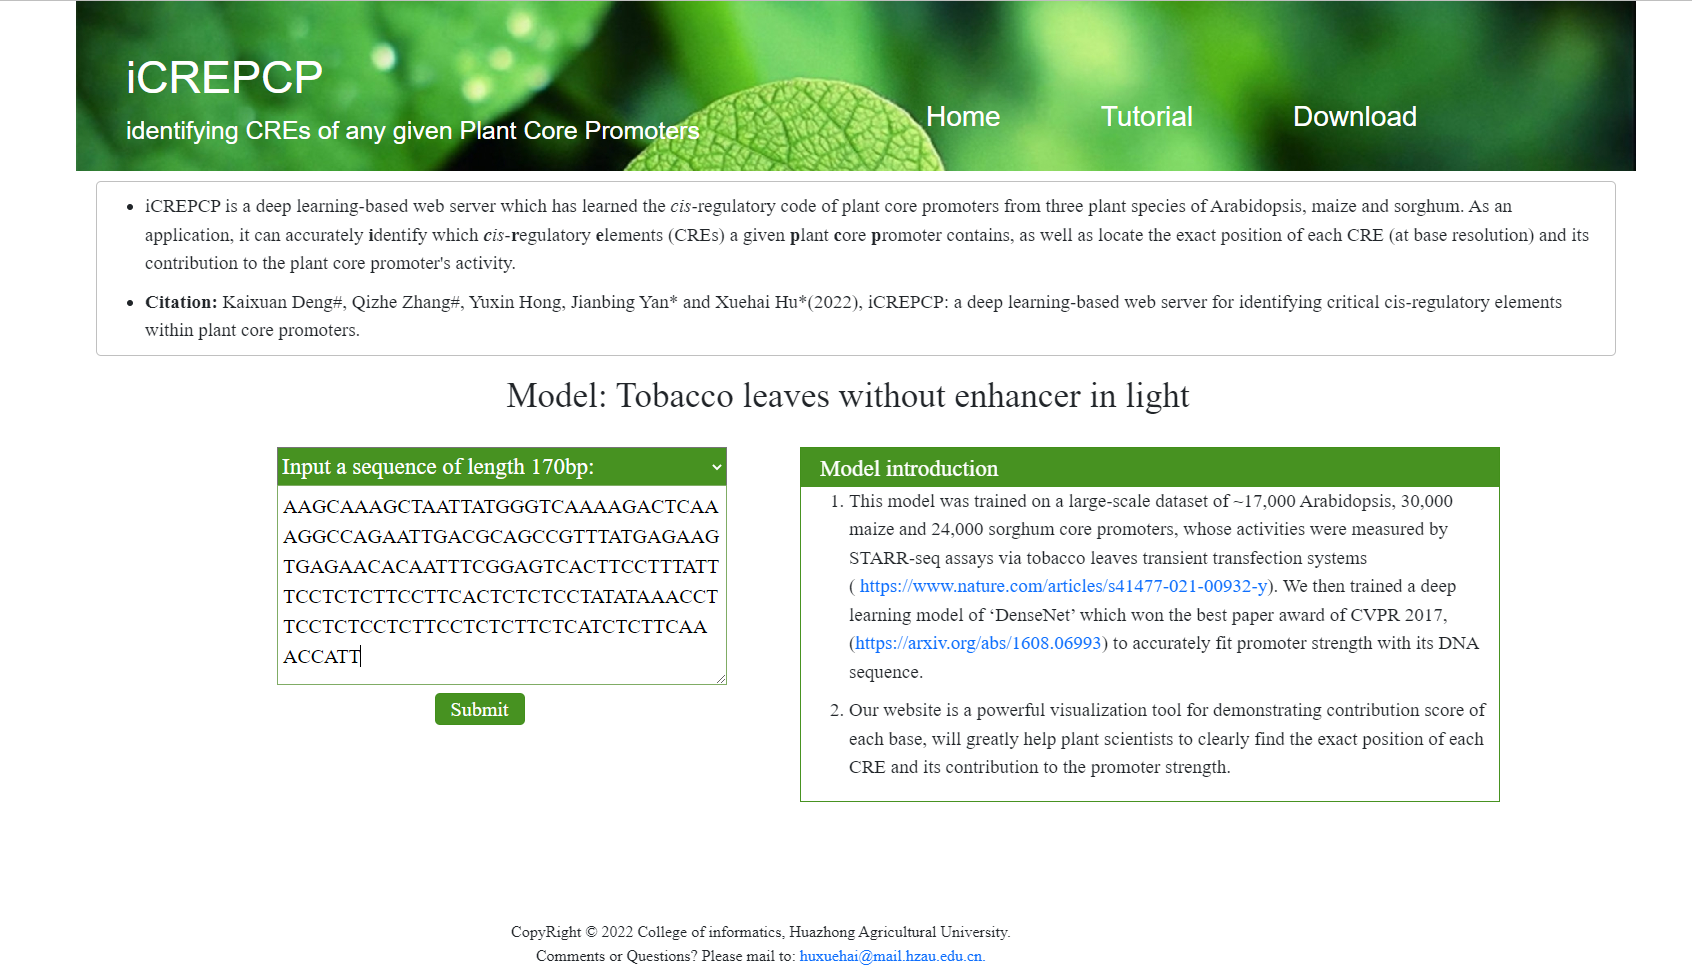
- After the model selected, you can choose to either input a 170bp DNA sequence or upload a fasta file containing multiple sequences.
- If you select to input a 170bp sequence, you should input a plant core promoter DNA sequence of length
170bp (from -165bp to +5bp of TSS) and it should be noted that:
- You should input one sequence at a time.
- There is no space or newline symbol in the input sequence.
- Only "A", "T", "C", "G", "N" should be included in the sequence.
- Your input should be exactly from -165bp to +5bp of TSS because any shift might lead the indentified motifs inaccurate.
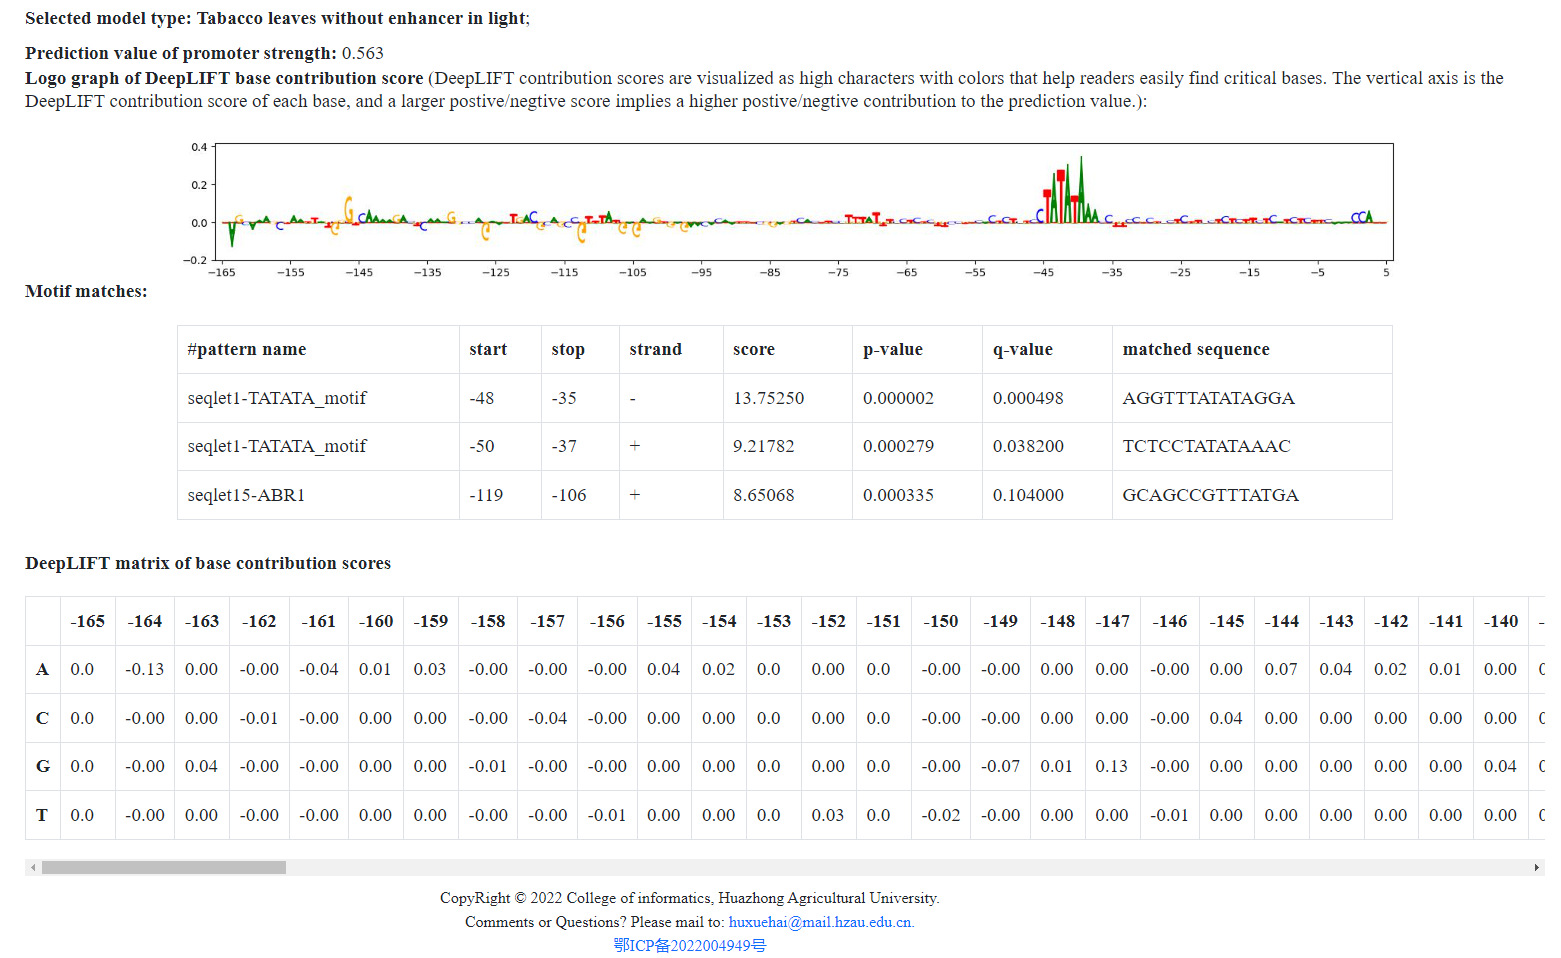
Wait 3~6 minutes, and then the DeepLIFT graph, prediction value of the input sequence, motif matchs and base contribution DeepLIFT scores matrix (see https://github.com/kundajelab/deeplift for more detail) will be shown in bottom of the page. The continuous ~5bp to ~23bp positions with high scores might imply motifs.
- The prediction value by the model can also be seen from the result page.
- The motifs types and their positions will be displayed in the result page.
- If you select to upload a fasta file, it should noted that:
- The file should be exactly in fasta format.
- Only comment line starting with '>' or DNA sequences could be included in the file.
- Each sequence should be 170bp and only "A", "T", "C", "G", "N" should be included in the sequences.
An example
As an example, let's input the core promoter region of an Arabidopsis thaliana gene AT4G04125, and the whole sequence can be downloaded from here.
- Select a model (Tobacco leaves without enhancer in light was selected in this example).
- Input the sequence into the text box.
- Cilck the submit button.


After 3~6 minutes, the results is shown in the following picture. DeepLIFT contribution scores are visualized as high characters
with colors that help readers easily find critical bases.
The vertical axis is the DeepLIFT contribution score of each base, and
a larger positive/negative score implies a higher positive/negative contribution to the prediction value.
